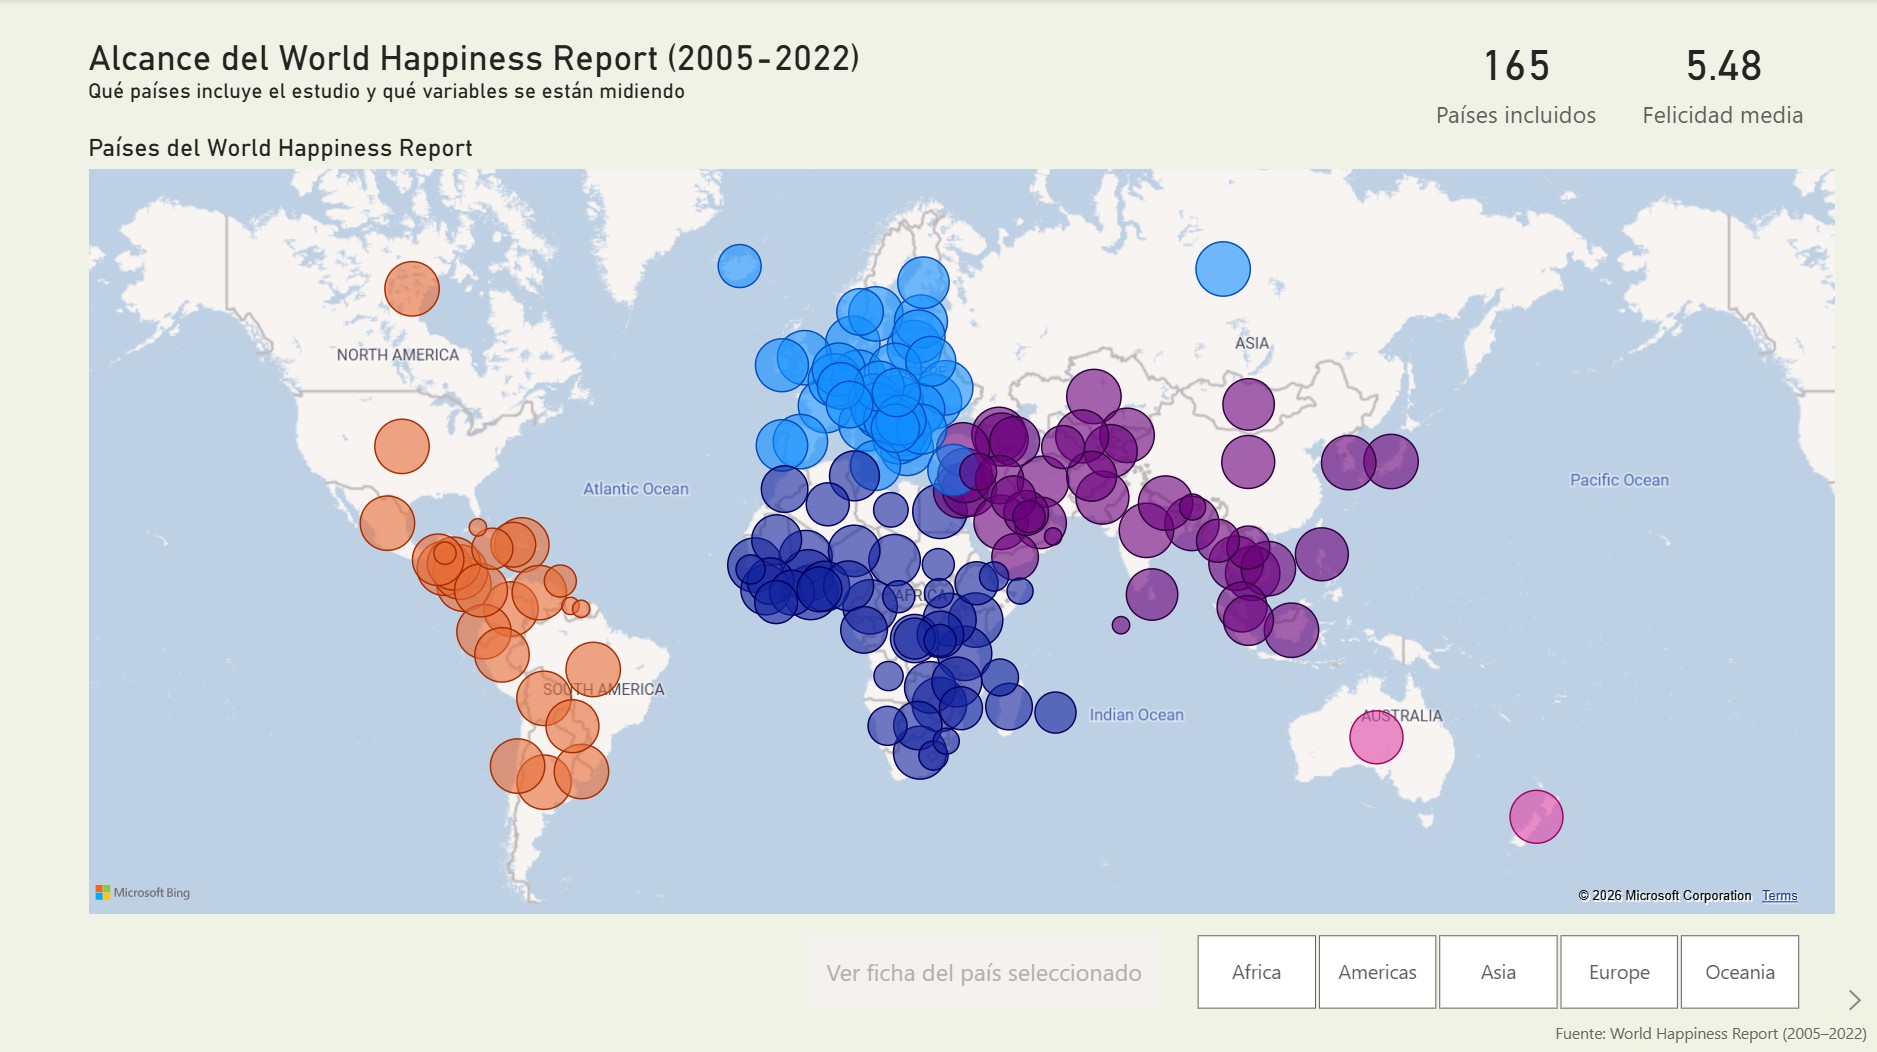
World Happiness Report Dashboard
Explored global well-being indicators through Python ETL workflows and interactive Power BI dashboards using World Happiness Report data.
Python · ETL · Power BI
Key Insights
- Economic prosperity alone does not explain happiness — social support and perceived freedom show equally strong correlations.
- Nordic countries consistently rank highest in reported well-being, reflecting strong social trust and institutional stability.
- Survey methodology and sample sizes vary across countries and years polled, introducing potential bias in global comparisons.
Project Overview
This project analyzes the World Happiness Report dataset to explore the social, economic, and behavioral factors associated with well-being across countries. The workflow combined exploratory data analysis, dataset transformation, and interactive visualization to examine relationships between variables such as life satisfaction, social support, and generosity.
A key component of the analysis involved reviewing World Happiness Report and Gallup documentation to understand how survey variables were collected and defined, as well as how methodological differences across countries could influence results.
The final outcome was an interactive Power BI dashboard allowing users to explore global trends, compare continents, and drill down into individual country-level indicators.
What I Worked On
- Analyzed World Happiness Report and Gallup documentation to interpret how variables such as life ladder, generosity, and social support are collected and defined.
- Performed exploratory data analysis to evaluate distributions, missing values, and potential reporting biases across countries.
- Developed reusable Python functions to automate dataset inspection tasks during EDA and ETL workflows.
- Collaborated on data cleaning and transformation pipelines using Python and Jupyter notebooks.
- Designed the global map visualization and built the country-level dashboard view in Power BI.
- Structured the dashboard narrative to guide users from global trends → continental comparisons → country-level insights.
- Served as Scrum Master, coordinating sprint progress and project milestones.