Friends Analytics Dashboard
Designed an interactive Tableau dashboard analyzing ratings, viewership, and episode-level trends across all ten seasons of Friends.
Tableau · Data Visualization · Storytelling · Data Cleaning
Key Insights
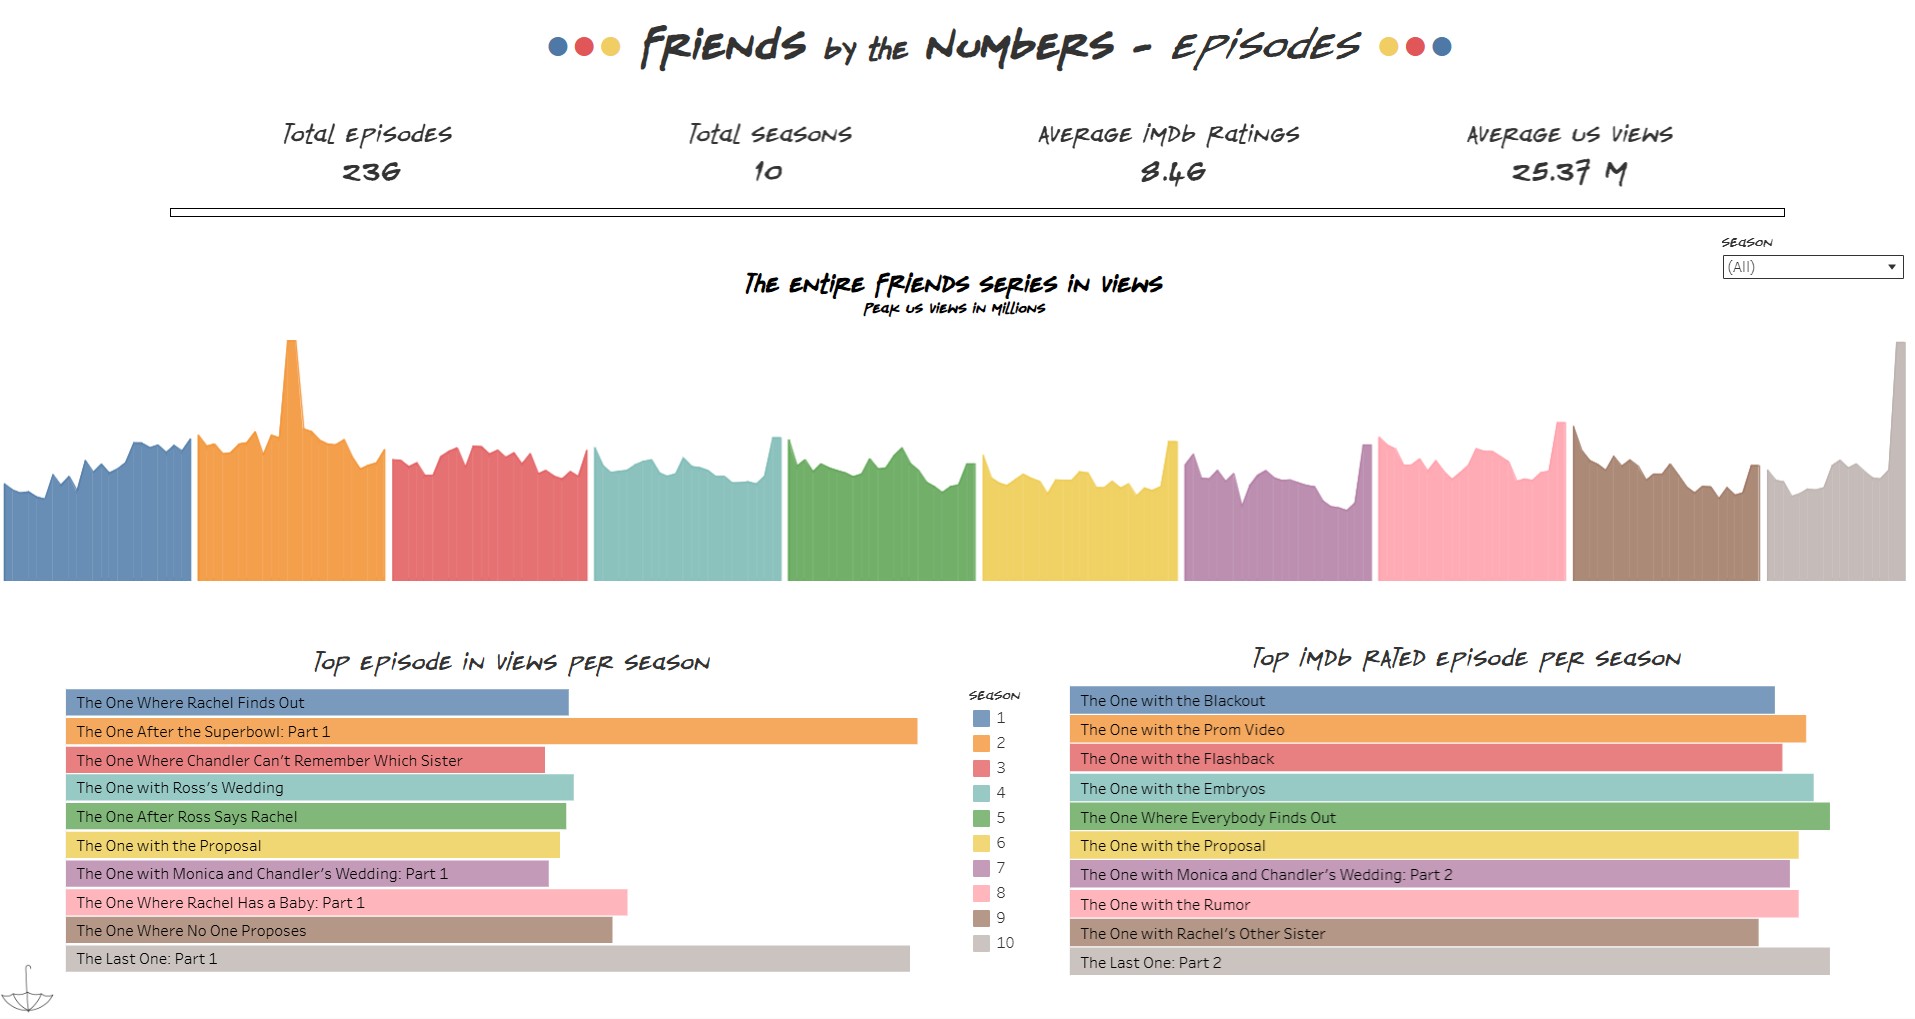
- Highest-rated episodes are not always the most-viewed broadcasts, suggesting differences between long-term audience appreciation and live broadcast popularity.
- Dialogue distribution concentrates heavily among the core cast, with certain characters dominating memorable quote frequency.
- Episode ratings cluster more tightly in later seasons, reflecting stabilized audience expectations as the series matured.
Project Overview
This project analyzes multiple datasets related to the TV series Friends to explore patterns in episode performance, audience engagement, and character dialogue across the series. The datasets include episode metadata, character quotes, and relationship information.
Initial exploration and preprocessing were performed in Python, while most data modeling and visualization were completed in Tableau. The final interactive dashboard examines episode ratings, broadcast viewership, and dialogue patterns across all ten seasons.
Special focus was placed on comparing the highest-rated episodes with the most-viewed broadcasts, revealing differences between audience reception and live broadcast popularity.
What I Worked On
- Performed exploratory data analysis and initial data cleaning across multiple Friends datasets including episode metadata, quotes, and character information.
- Prepared and transformed datasets for analysis, resolving inconsistencies such as naming variations and incomplete values.
- Designed and built the Tableau dashboard layout, incorporating the recognizable visual style of the Friends series.
- Developed visualizations analyzing episode ratings, broadcast viewership, and season-level performance.
- Created analyses comparing the top 10 highest-rated episodes and the top 10 most-viewed broadcasts.
- Built quote analysis visuals to examine dialogue distribution and memorable phrases across characters.
- Configured dashboard filters, tooltips, and interactions to improve usability and exploration.